
How Friend Overlap Analysis Reveals Hidden Accounts, Alternate Personas, and Social Graph Secrets
In the world of open-source intelligence, the most powerful insights rarely come from what is explicitly visible. Instead, they emerge from patterns, connections, overlaps, and relationships that most people never think to analyze.
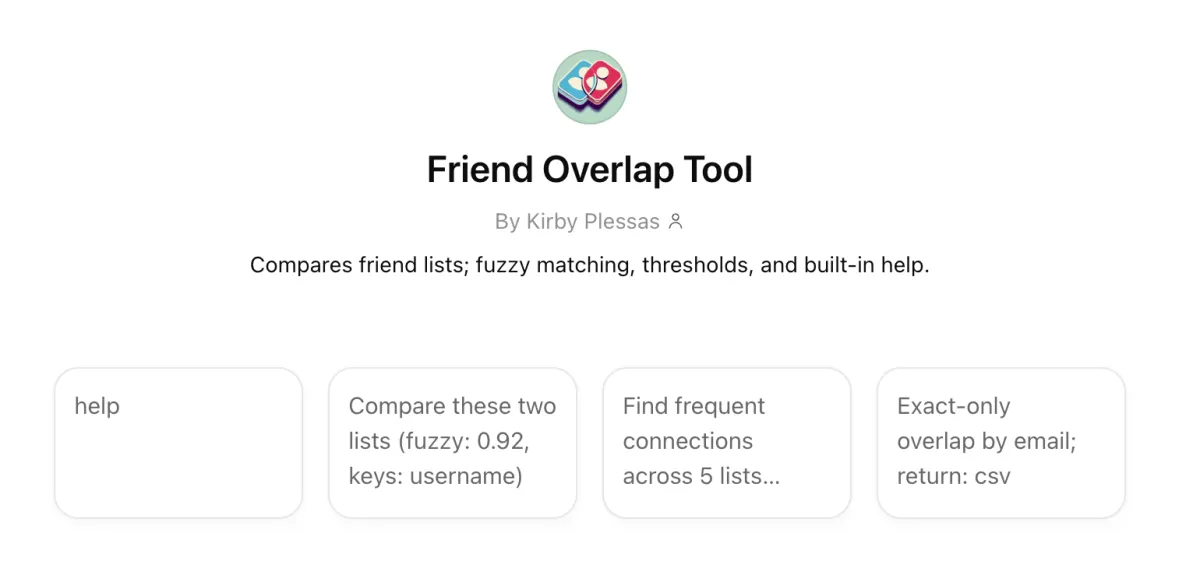
One of the most effective techniques for uncovering hidden accounts, alternate usernames, and even private friend lists is friend overlap analysis. Tools like this one I created using ChatGPT:
allow investigators and researchers to map relationships across social networks and infer information that is not directly exposed.
The Big Idea
Imagine this:
You have two accounts.
Each account has a list of friends.
You compare those lists.
If both accounts share a large number of the same friends, there’s a strong chance they belong to the same person, or at least the same social circle.
Now scale that idea:
Compare dozens of accounts
Track overlapping friend networks
Look for repeated patterns
Suddenly, you can:
Identify alternate accounts
Reveal hidden friend groups
Connect identities across platforms
Even if someone tries to stay anonymous, their network often betrays them.
The Academic Explanation
At a deeper level, this technique is based on social graph analysis.
A social graph is a network where:
Nodes = people/accounts
Edges = relationships (friendships, follows, interactions)
OSINT tools analyze this graph using concepts like:
1. Network Topology
The structure of how accounts connect to each other. Even if a user hides their profile, the shape of their connections can still be observed indirectly.
2. Link Analysis
By comparing shared connections, analysts identify statistical correlations between accounts.
3. Inference Attacks
Research has shown that hidden information can be reconstructed using surrounding data. For example:
Hidden friendships can be inferred through friends-of-friends relationships
Private attributes (location, interests) can be predicted based on network patterns
This is why even private settings are not always fully protective, because privacy often hides content rather than structure.
4. Friendship Inference Vulnerability
If one user hides a connection but another does not, that relationship can still be discovered. This inconsistency is one of the core weaknesses that overlap analysis exploits.
What You Can Find Using This Method
When applied correctly, friend overlap analysis can help uncover:
1. Alternate Accounts (Alts)
People often reuse:
The same friend groups
Similar social circles
Overlapping communities
Even if usernames differ, the network remains similar.
2. Accounts on Other Platforms
If you identify a cluster of users on one platform, you can:
Search those same names elsewhere
Compare overlap again
Identify matching clusters
This is a common OSINT pivot technique.
3. Hidden or Private Friend Lists
Even if a friend list is hidden:
Their friends may have public lists
Overlap across those lists reconstructs the original network
This is called network reconstruction.
4. Pseudonyms and Personas
People often maintain:
Professional identity
Personal identity
Anonymous identity (the “Finsta”)
But they frequently fail to fully isolate their networks.
Overlap reveals:
Shared contacts
Reused communities
Behavioral patterns
How to Use This Tool (Practical Workflow)
Step 1: Start with a Known Account
Pick a target account with at least partial visibility:
Public friends
Followers
Interactions
Step 2: Extract Connections
Gather:
Friend lists
Followers
Tagged users
Commenters
Step 3: Compare Against Other Accounts
Use the tool to:
Input multiple accounts
Identify overlapping connections
Measure similarity
Step 4: Look for Patterns
Key signals:
High overlap = likely same person or same group
Repeated clusters = shared identity space (like college friends or neighbors)
Unique overlaps = bridging accounts
Step 5: Pivot and Expand
Once you find an overlap:
Search those users elsewhere
Repeat the process
Build a larger network map
This is how small clues become full identity profiles.
This Works Because
Because we, as humans, are predictable. Even when trying to stay anonymous, people:
Keep the same friends
Join the same communities
Interact with familiar accounts
OSINT relies on patterns in public data that are incredibly hard to hide. Social media is a web of relationships that can be untangled.
Scenario
You suspect:
@john_doe_art
@jd_creates
are connected (or the same person).
*These examples are purely fictional, and any similarity to real users is coincidental and not intended.
But this time, instead of basic comparison, we’ll use parameter tuning to extract stronger signals and reduce noise.
Step 1: Input Multiple Lists
Instead of just comparing two accounts, you load 3–5 datasets:
Example:
List A → @john_doe_art followers
List B → @jd_creates followers
List C → commenters on @john_doe_art
List D → tagged users from both accounts
This is where multi-list analysis becomes critical.
Step 2: Configure Advanced Parameters
1. fuzzy: 0.92
This allows the tool to match similar usernames, not just identical ones.
Example matches:
john_doe_art ↔ johndoe.art
jd_creates ↔ jdcreates_
People reuse identities with slight variations.
Tip:
Use 0.85–0.93 for general work
Use 0.95+ when you want stricter matching
2. keys: username, name
This tells the tool what to compare, but only works if this information is provided and annotated (as in a spreadsheet column).
username → handle similarity
name → display name (often reused across platforms)
3. n: 5
Minimum mutual connections required to show a result.
What this does:
Filters out weak overlaps
Removes noise from random shared follows
Example:
Without n: you see 100+ weak matches
With n: 5: only accounts with 5+ shared connections appear
Now you’re looking at meaningful relationships.
4. min_presence: 3 of 4
This is one of the most powerful parameters.
It means:
Only show users who appear in at least 3 out of 4 lists.
This isolates core network members.
Instead of casual followers
You get:
Close friends
Inner circle
Highly connected nodes
This is how you identify real-world relationships and strong identity signals
5. freq_mode: frequency
This changes how importance is calculated.
Options:
binary → appears or not (basic)
frequency → how often they appear across datasets
Frequency is powerful because, if someone appears:
Once → weak signal
6 times across lists → strong signal
This helps you identify central figures in the network and key connectors
6. group by: platform
This organizes results like:
Instagram cluster
Twitter/X cluster
TikTok cluster
So you can spot cross-platform identities and see where overlap is strongest
Example:
Heavy overlap on Instagram + TikTok
No overlap on LinkedIn
→ suggests personal vs professional separation
7. exact only: OFF
Keep this OFF for discovery. Turning it ON is useful later when:
You want to confirm exact matches only
You’re validating findings
8. show_counts: off
This simplifies output. Turn it ON when:
You want raw numbers for reporting
You’re exporting results
9. return: csv
Critical for advanced workflows so you can:
Import into Excel, Maltego, Analyst’s Notebook
Visualize in Gephi or Excel
Build network graphs
Run additional analysis
Step 3: Example Scenario Output Interpretation
After running with:
fuzzy: 0.92
n: 5
min_presence: 3 of 4
freq_mode: frequency
You get:
Result:
User: @mike_visuals
Appears in 4/4 lists
12 total overlaps
High interaction frequency
This means this account is deeply embedded in both networks, likely part of the same real-world circle, and possibly a close friend, collaborator, or secondary account
Now repeat for multiple nodes, and you’ll start to see:
A core cluster of 10–20 accounts
Repeating across datasets
That cluster is your identity fingerprint.
Step 4: Turning This Into Attribution
Now combine signals:
High overlap cluster
Username similarity (fuzzy match)
Same interaction group
Cross-platform presence
At this point, you’re building a probabilistic identity model.
Simple Explanation
Think of these parameters like filters on a photo. Without them, everything is blurry, and there is too much noise. With them, only the important people stand out. And that may tell you who someone really is, no matter what username they use.
Insight
The most powerful combo in this tool is:
min_presence → finds the core group
n → removes weak connections
frequency mode → highlights importance
Together, they don’t just show overlap; they reveal structure and expose hidden identities.